Map Layers
Map Layers: ArcGIS Feature/Map Service
1. What the ArcGIS Feature/Map Service layer does
The ArcGIS Feature/Map Service layer overlays live geographic data from any public ArcGIS service onto the tracking map — wildfires, weather warnings, earthquakes, traffic incidents, infrastructure, boundaries, land management, and thousands of other datasets. Both kinds of ArcGIS service URL work:
- Feature services (URLs ending in
/FeatureServer) publish individual features the map draws as interactive shapes. - Map services (URLs ending in
/MapServer) publish the same kinds of data — often at national scale — and can also render the imagery on the ArcGIS server itself, which keeps even enormous datasets fast and crisp.
Data draws with the service's own symbology, so a fire-perimeter service shows its perimeters in the same colors and styles its publisher designed. For services hosted on ArcGIS Online, GSatTrack also applies any custom styling the service's owner saved for it (the same styling ArcGIS Map Viewer shows), so classified color ramps and category symbols match what the publisher intended.
A ready supply of publishable services is Esri's ArcGIS Living Atlas of the World at livingatlas.arcgis.com — a curated catalog of authoritative public layers. Find a Feature layer or Map image layer there, copy its URL from the details page, and paste it straight into the map layer form (Section 2).
The layer suits Government and Emergency Response teams adding incident context (active fires, storm warnings) around their assets, Energy and Utilities operators overlaying infrastructure and hazard data, Maritime operations adding official boundaries and zones, and any team that wants an authoritative public dataset behind their fleet.
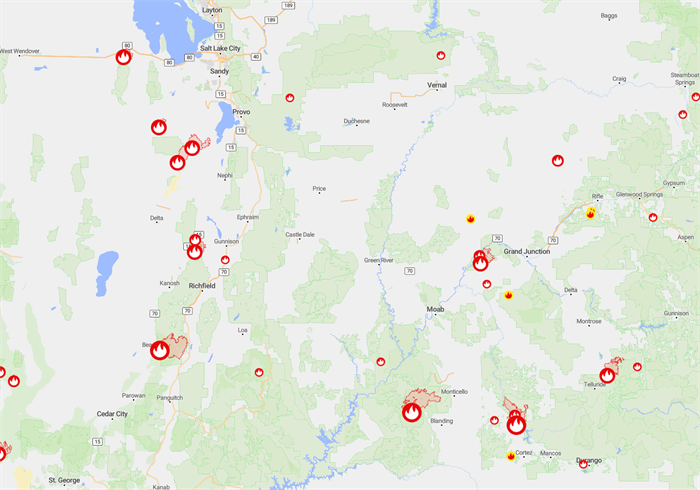
Figure 1 — An ArcGIS Feature/Map Service layer (USA Wildfires) active on the map.
2. Enabling it (administrator): create the map layer
Creating the layer is a one-time, administrator-only step. It stores the service URL and how the service's layers should draw.
Step 2.1 — Find a service URL
Any public ArcGIS FeatureServer or MapServer URL works. The easiest place to browse is the ArcGIS Living Atlas at livingatlas.arcgis.com: search or browse for a dataset, and filter to Feature layer or Map image layer item types.
On any layer's details page, find the URL panel and copy the service URL — it ends in /FeatureServer or /MapServer. That single copy/paste is all you need from the ArcGIS side.
Looking for services beyond the Living Atlas — datasets specific to your industry, region, or agency? See Finding Public ArcGIS Services for where to search and how to vet what you find.
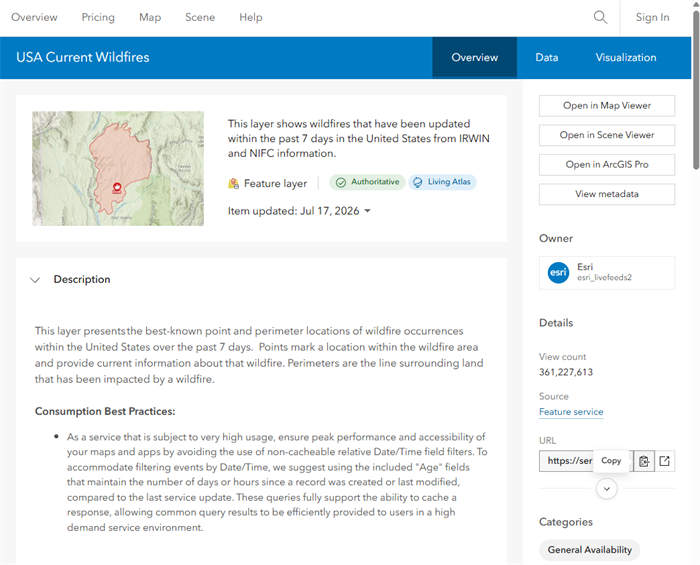
Figure 2 — Copying a Feature layer's URL from the Living Atlas.
Tip: A URL for one specific layer (ending in
/FeatureServer/0or/MapServer/3) works too — the form converts it to the service root and pre-selects that layer for you.
Step 2.2 — Add a map layer
In GSatTrack, go to Manage › Map Layers, then click Create Map Layer.
Step 2.3 — Choose the ArcGIS Feature/Map Service type
Set Type to ArcGIS Feature/Map Service (this type handles both FeatureServer and MapServer URLs). The form shows the URL field with a Load layers button, a Service Layers picker, and the ArcGIS-specific options described below.
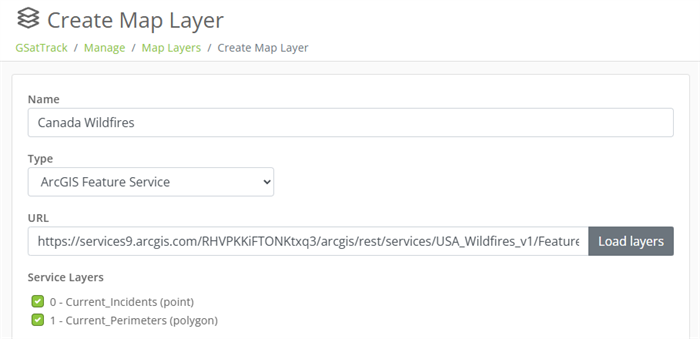
Figure 3 — The map layer form configured for an ArcGIS Feature/Map Service.
Step 2.4 — Paste the URL and load its layers
Paste the copied service URL into URL and click Load layers. The form contacts the service and lists every layer it offers as a checkbox — numbered id, name, and geometry kind (point, line, or polygon), for example:
- 0 - Current_Incidents (point)
- 1 - Current_Perimeters (polygon)
If the URL can't be read, the form says so — check the URL is a public /FeatureServer or /MapServer address and try Load layers again.
Step 2.5 — Pick the service layers to draw
Tick the layers you want on the map (a fresh load starts with all of them ticked). At least one must be selected — Save stays disabled until then. All selected layers draw together under the single map-layer toggle.
Step 2.6 — Choose how the layer renders
The Rendering option controls how the data reaches the map:
- Features (vector) — each feature is drawn in the browser as an interactive shape you can click directly. Best for regional datasets of moderate size.
- Image (server-rendered) — the ArcGIS server draws the current view and sends it as a map image, with exactly the cartography its publisher designed. Best for dense or national-scale datasets, which stay fast and crisp no matter how many features are in view. Clicking the map looks up the features at that point (Section 4).
The form pre-selects the right mode for the URL you loaded: FeatureServer services use Features (Image isn't offered — those services can't render server-side), and MapServer services default to Image, with Features still selectable when the service supports it. Some MapServer services only support server rendering; for those, Features is disabled with an explanatory note. Editing a saved layer always keeps the mode you chose.
In Image rendering an Opacity field (0–100, under Advanced Options) is also available, fading the server-drawn imagery so the base map shows through — useful when a dense national dataset would otherwise cover everything beneath it. Feature rendering has no opacity setting: vector features keep the transparency their publisher designed into the symbology itself.
Step 2.7 — Optional: filter the data
Data filter (under Advanced Options) scopes the layer to a slice of the dataset — for example status = 'ACTIVE', or a region code like admin_org_id LIKE '0517%' to show one forest out of a national land-management service. The filter is applied by the ArcGIS service itself, to every selected layer, in both rendering modes — filtered-out features are neither drawn nor returned by map clicks. The syntax is standard ArcGIS definition-expression SQL, evaluated by the remote service; use the live preview (Step 2.9) to confirm it selects what you expect.
Step 2.8 — Optional: hide the legend
When a legend is available for the selected layers — published by the service, or built from the styling of an ArcGIS Online hosted service — the map shows it in the Layers Legend panel (Section 4), and the form offers a Hide legend Yes/No choice under Advanced Options (default No). Set it to Yes to keep this layer out of the legend panel. The option only appears once a legend is confirmed to be available for the current URL and layer selection.
Step 2.9 — Review the zoom range and the live preview, then save
For ArcGIS layers the preview map is always visible and updates by itself a moment after any change — URL, ticked layers, rendering mode, filter, or zoom range — with no Preview button press. The preview starts framed on the area the service covers, and its legend and click popups behave exactly as they will on the tracking map.
Minimum/Maximum zoom (under Advanced Options) are pre-filled from the service's own advertised visibility range when you create the layer (or point it at a different service) — keep them, adjust them, or clear them for no restriction.
| Field | What to enter | Required |
|---|---|---|
| Name | A friendly label for the layer, shown to users in the Layers menu and legend. | Yes |
| URL | The service URL from Step 2.1 (ends in /FeatureServer or /MapServer). | Yes |
| Service Layers | The service's layers to draw (Step 2.5). | At least one |
| Rendering | Features (vector) or Image (server-rendered) (Step 2.6). | Pre-selected |
| Opacity | 0–100; fades the server-drawn imagery. Image rendering only; under Advanced Options (Step 2.6). | — |
| Data filter | Optional server-side filter applied to every selected layer, e.g. status = 'ACTIVE'. Under Advanced Options. | — |
| Hide legend | Yes keeps this layer out of the Layers Legend panel. Shown under Advanced Options when a legend is available. | — |
| Minimum zoom / Maximum zoom | Only draw the layer within this zoom range (0–18). Pre-filled from the service's own range; under Advanced Options. | — |
Click Create Map Layer (or Save Changes when editing) to save.
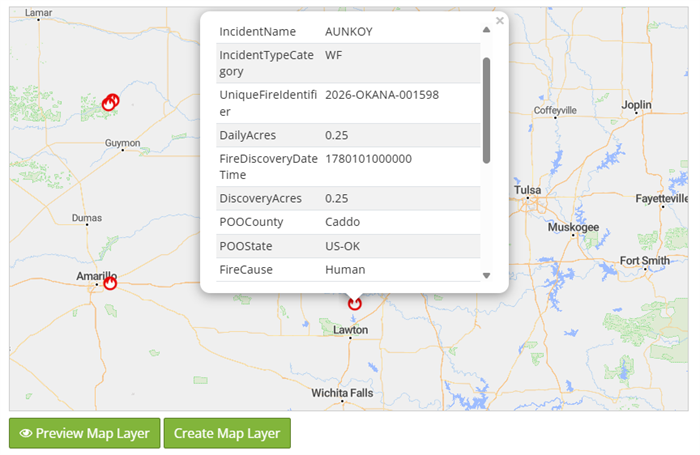
Figure 4 — The live preview while configuring the layer.
Editing later: reopening a saved layer automatically reloads the service's layer list with your saved selection ticked, so you can confirm or adjust it at a glance.
3. Turning the layer on
Open the Layers control from the Map Mode Indicator in the top-right corner of the map and toggle your ArcGIS Feature/Map Service layer on. Toggle it off the same way to clear it from the map.
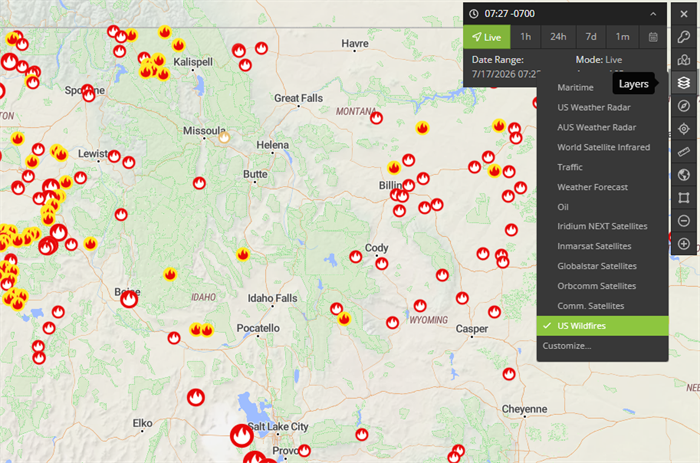
Figure 5 — Turning the layer on from the Layers menu.
4. Reading the map
The layer draws with the service's symbology
Points, lines, and polygons appear in the colors, icons, and styles the service's publisher designed — including services whose styling is computed from feature attributes (for example, wildfire perimeters shaded by containment), and custom styling the owner saved on ArcGIS Online. What you see matches the dataset's own maps. In Image rendering the imagery is drawn by the ArcGIS server itself, so it is pixel-identical to the publisher's cartography.
If the layer has a zoom range (Step 2.9), it appears only while the map is inside it.
The Layers Legend panel
A legend for the active ArcGIS layers appears in the Layers Legend panel at the bottom-right of the map, listing each symbol with its label — including classified ranges (for example dollar-value bands) when the service defines them. Click the panel's header to collapse it to a compact Layers button; the map remembers your choice. Layers whose administrator chose Hide legend don't appear in the panel.
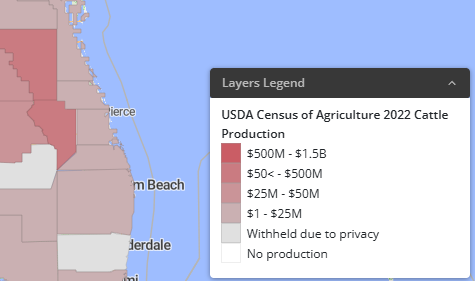
Figure 6 — The Layers Legend panel for an active ArcGIS layer.
Click for details
What a click does depends on the rendering mode:
- Features (vector): click any feature to open its details popup — a Property / Value table of everything the service publishes about that feature. Long tables scroll inside the popup, and you can search the properties or click a column header to sort.
- Image (server-rendered): click anywhere on the map and GSatTrack asks the service what is at that point, then opens a single popup combining every result — across all of your active image-rendered ArcGIS layers — grouped by layer and sublayer, with one property table per feature. A link list at the top of busy popups jumps straight to each result, and very busy click points show the first 25 results with a note saying how many there are in total.
In both modes, property names use the service's friendly field labels, and when the layer's owner has configured a popup on ArcGIS Online, its chosen fields, labels, title, and number and date formatting are used — dates follow your GSatTrack date preference. If a filter is set on the layer (Step 2.7), filtered-out features never appear in click results.
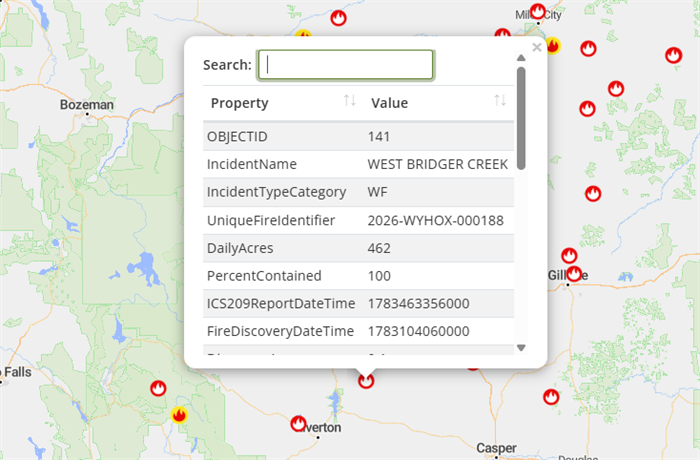
Figure 7 — The feature details popup.
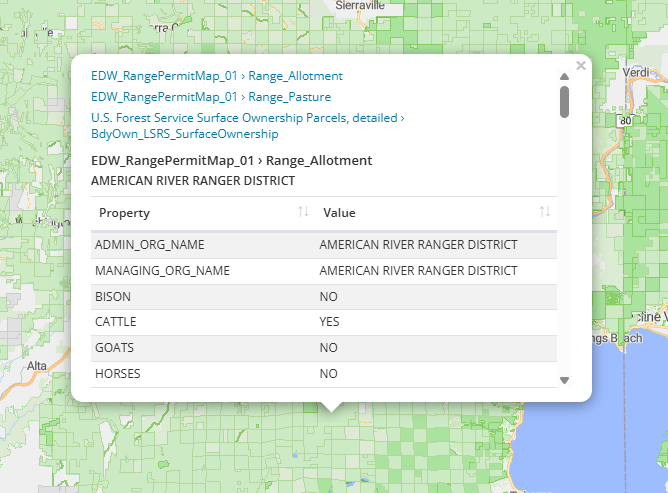
Figure 8 — A combined results popup from an image-rendered layer, grouped by sublayer.
Quick reference
- Where to find it: Map Mode Indicator → Layers → your ArcGIS Feature/Map Service layer.
- Prerequisites: an administrator-created layer pointing at a public ArcGIS
/FeatureServeror/MapServerURL. - Find services: browse the ArcGIS Living Atlas (livingatlas.arcgis.com), open a Feature layer or Map image layer's details page, and copy its URL — or see Finding Public ArcGIS Services for industry-specific sources and search techniques.
- Enable it (admin): Manage › Map Layers › Create Map Layer → Type ArcGIS Feature/Map Service → paste the URL → Load layers → tick at least one service layer → confirm the pre-selected Rendering mode → optionally add a Data filter → watch the live preview → save.
- Rendering modes: Features (vector) draws clickable shapes in the browser; Image (server-rendered) has the ArcGIS server draw the view — best for huge datasets; click the map to look up what's at that point.
- Sublayer URLs: pasting a
/FeatureServer/0- or/MapServer/3-style URL auto-converts to the service root with that layer pre-selected. - Data filter: optional SQL where clause (e.g.
status = 'ACTIVE') applied server-side to every selected layer, in both rendering modes and in click results. - Legend: active ArcGIS layers appear in the collapsible Layers Legend panel (bottom-right); the admin's Hide legend option removes a layer from it.
- Reading features: drawn with the publisher's symbology (including styling saved on ArcGIS Online); click for a searchable, sortable property table — in Image rendering, one popup combines every result at the click point, grouped by layer.
- Zoom range: optional Minimum/Maximum zoom (0–18), pre-filled from the service's own advertised range.